What belongs on a school leadership dashboard?
A useful school dashboard connects weekly metrics with open work, evidence and the decisions leaders actually make.
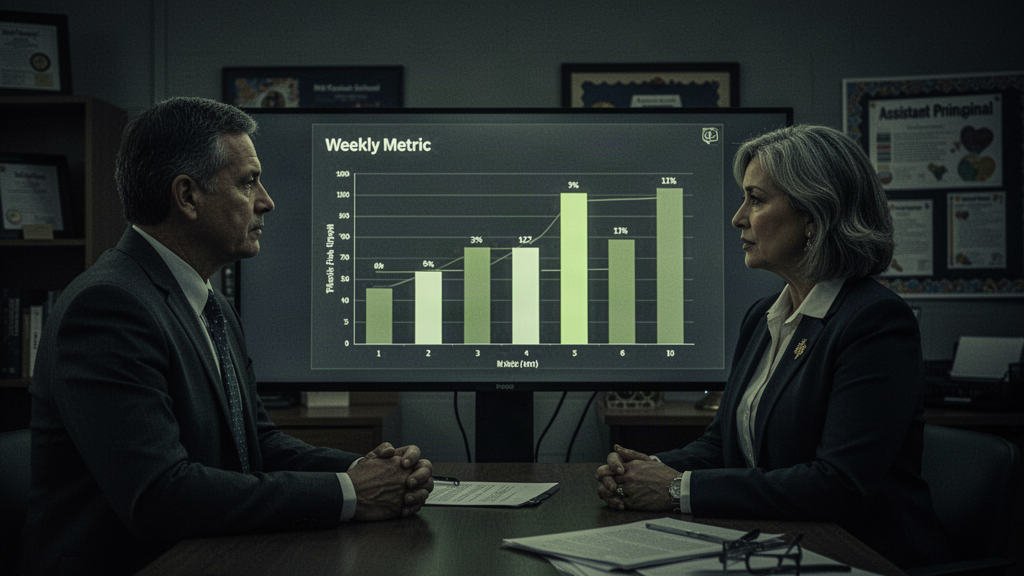
Start with decisions, then select the measures
A dashboard can become crowded quickly. Before adding a chart, ask what decision it should support. A school leader may need to know whether attendance changed, whether enrollment is moving, whether testing is on track, and which operational barriers are still open. If a number cannot lead to a question, an owner or a decision, it may belong in a deeper report instead.
A weekly leadership view works best when it shows the current figure, its reporting period and a fair comparison with an earlier period. A single attendance percentage without a date, denominator or context can mislead. Make missing data visible rather than filling it with an estimate.
A workable first dashboard
Start with aggregate enrollment, attendance, new enrollments, withdrawals, testing completion and the number of unresolved tasks. Add a director note explaining what changed and what needs support. Then show the status of actions agreed in the prior meeting. This is enough to make the first review useful without asking staff to maintain a second data warehouse.
The operational queue matters as much as the metrics. An attendance trend and an open transportation task tell a different story together than either does alone. Treat their connection as a reason to investigate, not proof of a cause.
Make a weekly review repeatable
Use the same reporting window and definitions each week. Check whether the previous actions were completed. Assign the next step to a person and record a due date. Return to that decision in the next review. This discipline turns a dashboard from a presentation artifact into a management habit.
OnwardSync’s weekly matrix records building-level metrics. Port combines recent check-ins with operational records and suggests evidence-linked follow-up for a director to approve. The workflow keeps the original figures, the proposed next step and its eventual status in view.
Keep people in the loop
A chart should help staff spend less time reconstructing the week and more time responding to it. Share the relevant conclusion with the people who can act, and keep sensitive individual student information in the systems intended for it. If the dashboard is useful only to the person who made it, redesign the handoff.
Use the free weekly checkup to practice a small version of this rhythm, then explore the leadership dashboard and operations workspace for a connected school view.